

What ‘90% Days’ Are Telling Us About Market Volatility
Friday, May 23, 2025
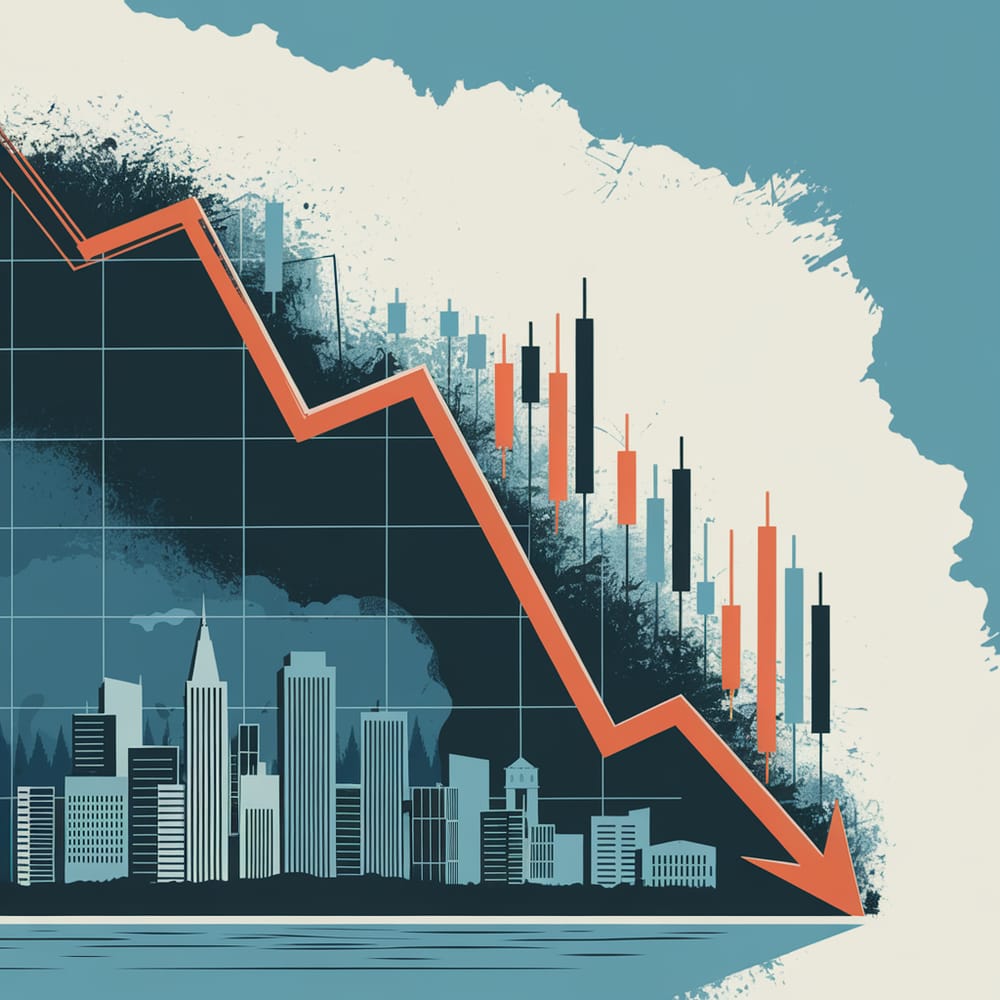
The stock market has seen a spike in so-called “90% days”—sessions where either 90% of trading volume or price movement goes in a single direction. This rare phenomenon is flashing a big yellow light for investors.
Over the past month, the market has logged four 90% days, split evenly between up and down. While that may sound balanced, historically, a rise in frequency of these extreme days has signaled increased volatility and looming trouble. During past financial crises, the 90% day count over a 50-session window has reached 20 or more—a clear marker of market instability.
Though the S&P 500 is holding above 5,800, a key support level, warning signs are appearing beneath the surface. Market breadth is weakening, and internal indicators like the put-call ratio and volatility bands are flirting with bearish signals. If the S&P 500 drops below 5,700, it could revert the broader trend back to a bearish stance.
On the bullish side, cumulative volume breadth (CVB) recently hit a new all-time high, typically a reliable signal that the market will soon follow suit. However, that’s being tempered by signs of potential sell signals from breadth oscillators and a looming VIX trend reversal if volatility persists.
Bottom line: For now, bulls still have the upper hand—but rising 90% days are a reminder that markets are growing fragile. If volatility expands, investors should be ready to adjust quickly. Stay nimble, and don’t mistake noise for trend.
© Copyright 2024. All Rights Reserved.
© Copyright 2024. All Rights Reserved.