

The Dollar May Be Set for a Rebound—Here’s What the Charts Suggest
Wednesday, June 18, 2025
After a rough start to the year, the U.S. dollar may finally be due for a bounce—and technical signals are flashing green.
The ICE U.S. Dollar Index, which tracks the dollar against a basket of major currencies, has fallen nearly 10% year-to-date, recently hitting its lowest level since March 2022. But chart watchers are now spotting a classic setup for a reversal: a bullish divergence between price and momentum.
The key indicator? The Relative Strength Index (RSI), a widely followed measure of momentum. While the dollar’s price made a new low last week, the RSI didn’t. Instead, it made a higher low, suggesting sellers are losing steam and buyers may be preparing to step in.
This exact pattern played out in September 2024, and it led to a sharp rally in the dollar over the following weeks.
Adding to the case for a rebound, investor sentiment has turned extremely bearish—often a contrarian indicator—and 10-year Treasury yields have been rising. The dollar and Treasury yields are typically closely correlated, and even a small reversion toward their historic relationship could support a dollar bounce.
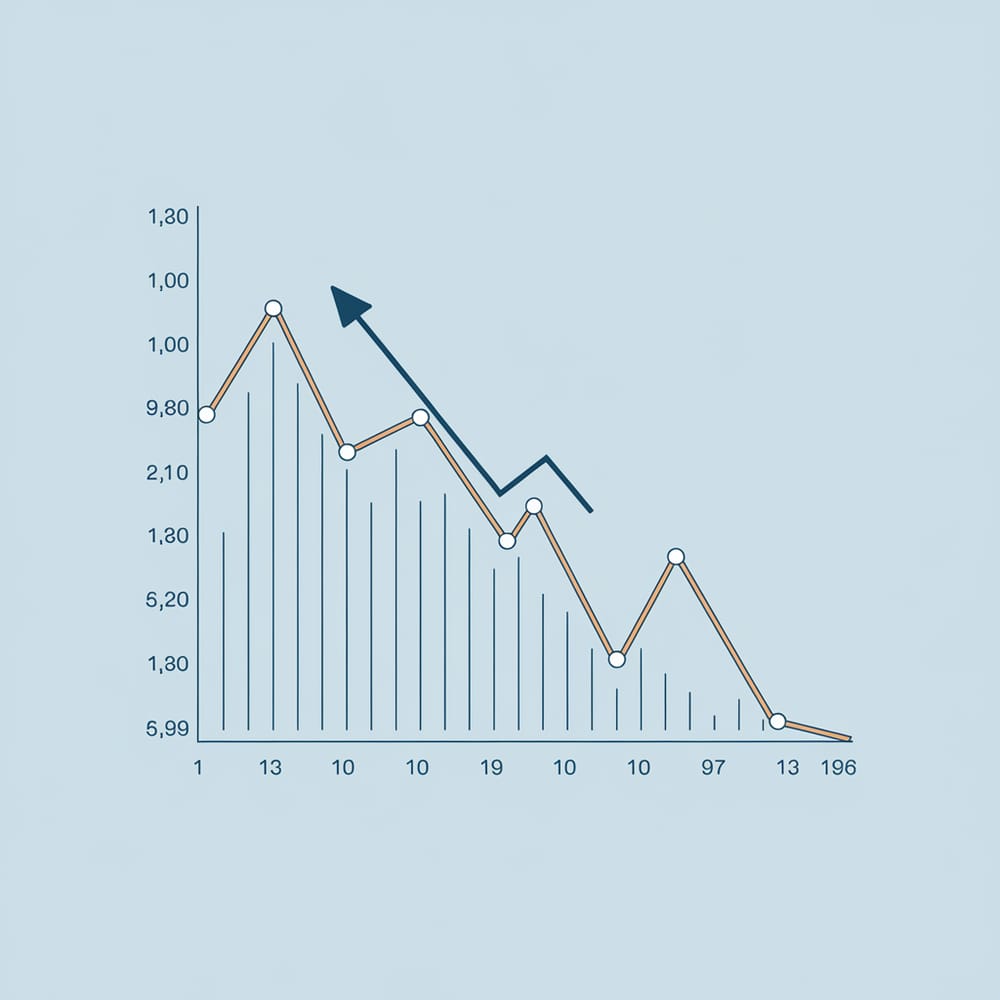
Visually, the charts highlight this divergence:
-A falling price trend in the dollar index
-A rising RSI bottoming above its April low
-A tightening setup just below a downtrend line connecting the February and May peaks
A break above the May 12 close of 101.79 would break the pattern of lower highs and likely confirm the bounce. But on the flip side, a drop below the June 12 close of 97.92, paired with a declining RSI, would invalidate the bullish thesis.
Bottom line: The dollar may be oversold—but not out. Technical momentum, sentiment extremes, and bond market dynamics are all aligning in favor of a short-term bounce. But traders will be watching key resistance and support levels closely to confirm the next move.
© Copyright 2024. All Rights Reserved.
© Copyright 2024. All Rights Reserved.