

S&P 500 Breaks Above Key Level—But Don’t Fall for the Hype
Tuesday, May 20, 2025
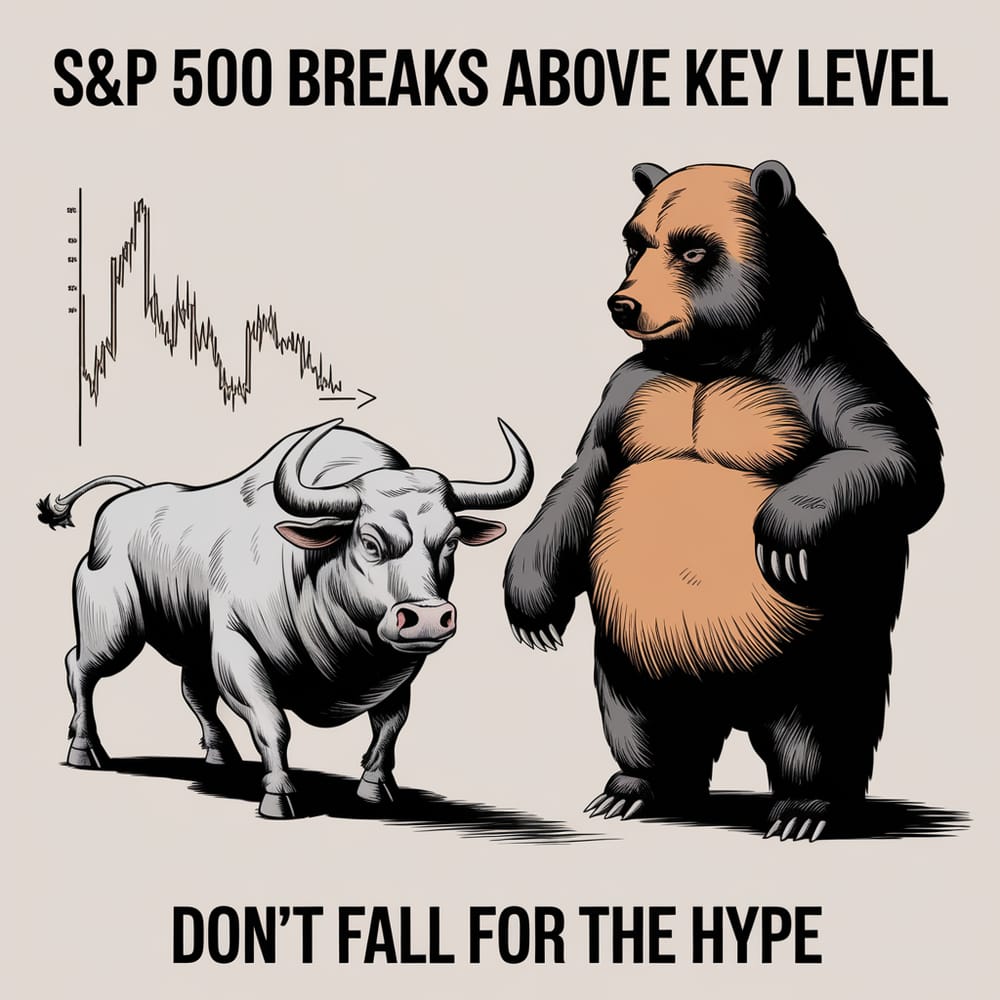
The S&P 500 recently closed above its 200-day moving average, and bulls are cheering it as a sign the uptrend is alive and well. But the historical data says: calm down.
This technical milestone is often touted as a bullish breakout, but in reality, it’s not the rocket fuel many investors think it is. A deep dive into nearly a century of market history shows that when the S&P 500 closes above its 200-day moving average—after being below it the day before—subsequent performance isn’t meaningfully better than usual.
Short-term gains? Maybe a little better. But over the next 12 months? Returns actually trend slightly lower than average. And once you account for transaction costs, the signal becomes even less meaningful.
So why the fuss? Mostly momentum hype. The emotional power of a “buy signal” like this often outweighs its statistical substance. But if you're betting big based on this one metric, you may be building a portfolio on sand.
The truth is, markets are complex. Moving averages are just one input—and a mediocre one at that. So before you rush in on the back of a feel-good chart, remember: there are far more important forces at play than where the index sits relative to a line on a graph.
© Copyright 2024. All Rights Reserved.
© Copyright 2024. All Rights Reserved.