

What Changed After 0.34? $SDA’s +77.78% LONG MOVE Into a Late Vertical Push
Friday, November 06, 2026
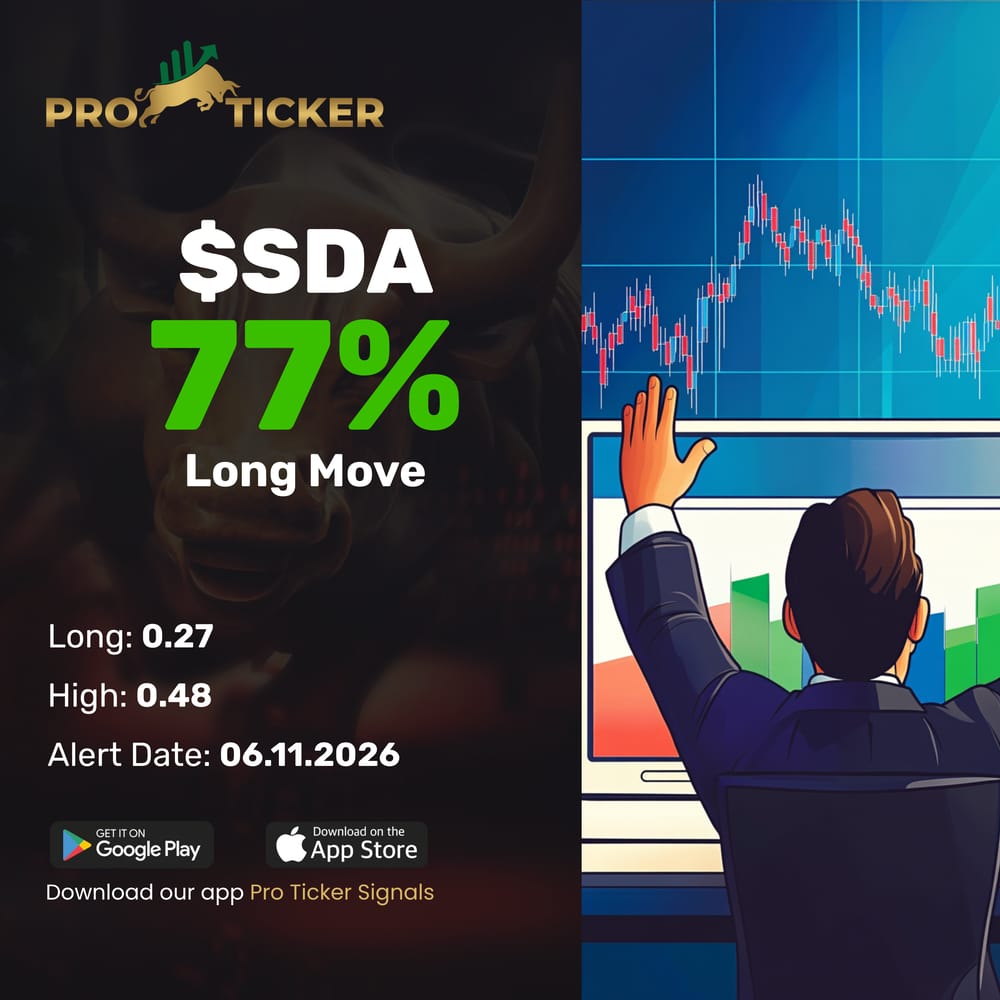
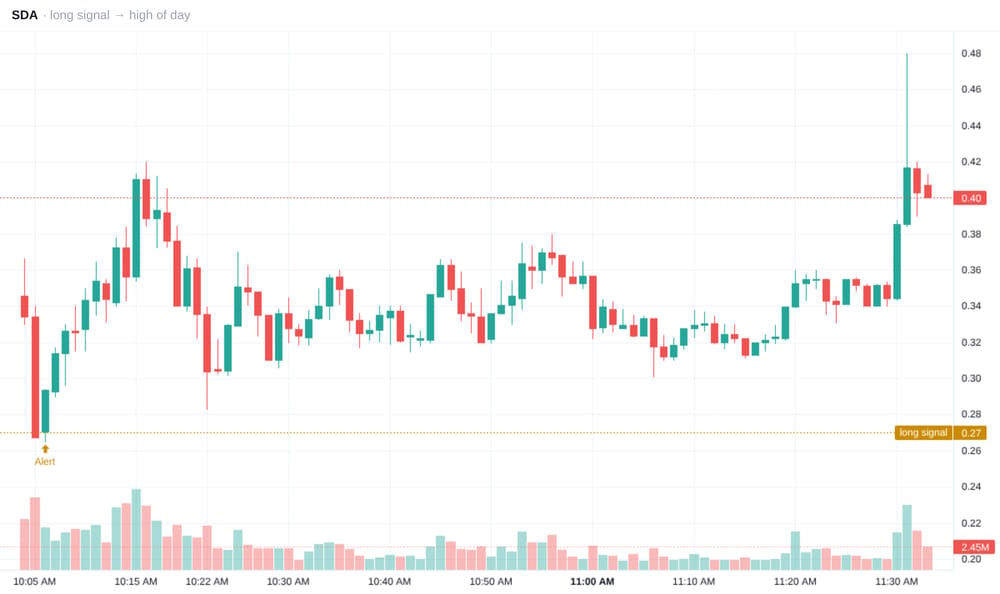
At 10:06 AM ET on Friday, November 6, 2026, Pro Ticker provided a long signal for $SDA at 0.27. Eighty-five minutes later, at 11:31 AM ET, the stock printed its HIGH OF DAY at 0.48—a +77.78% LONG MOVE from the signal.
Between those two prices, the chart tells a more demanding story than a straightforward climb: an abrupt reversal, an early spike toward 0.42, a deep retracement, repeated range rotations, and finally a two-candle acceleration into an unusually long upper wick.
The Setup
The opening scene was selling pressure, not orderly compression. Just before the signal, a large red candle drove $SDA from roughly 0.33 through 0.27. The next candle briefly probed lower before reversing upward and finishing near 0.294.
That immediate recovery established 0.27 as the reference point for the rebound. Buyers then extended the advance through 0.30 and into the low 0.33s.
* Candle structure: A wide red body was followed by a substantial green recovery candle, then additional upside progress.
* Volume: The selloff carried elevated activity; the initial recovery began with smaller volume bars before participation expanded later.
* Risk reference: The reversal low sat slightly below the signal, making 0.27 a decision area rather than guaranteed support.
The supplied chart shows candles and volume, but no VWAP, VWMA, RSI, or order-book data. Their exact positioning and readings cannot be verified. Likewise, stacked bids and transaction-level red prints cannot be inferred from candle colors alone.
The Breakout
The first BREAKOUT developed quickly. After a brief hesitation near 0.325, $SDA pushed through 0.34, approached 0.37, and absorbed a sharp red interruption before launching a large green candle toward 0.41 around 10:15 AM.
Volume expanded noticeably into that thrust. The tallest visible volume bar accompanied the early green expansion candle—not the eventual HIGH OF DAY.
But the advance did not hold its full extension. A wick reached approximately 0.42, followed by a sequence of lower closes and increasingly consequential red bodies.
* Upside expansion: Larger green bodies carried price beyond the preceding candles’ highs.
* RELATIVE VOLUME context: Activity increased versus nearby bars, although a formal historical RELATIVE VOLUME ratio is not supplied.
* Failed acceptance: Price traded above 0.40 but could not establish a durable base there.
By roughly 10:22 AM, $SDA had retreated toward 0.30, with a lower wick reaching approximately 0.283. The early surge had produced momentum, but not lasting control of the upper range.
The Midday Surge
The next stretch tested patience. $SDA rebounded toward 0.35, faded again, and spent much of the following hour rotating through the low-to-mid 0.30s. Rally attempts near 0.36–0.37 repeatedly encountered supply.
This middle section was not a clean, uninterrupted BULL FLAG. Its deep retracements and overlapping candles described a broad rebuilding range.
Around 11:06 AM, another lower wick tested approximately 0.30. Later selling stalled closer to 0.313, and small-bodied candles began working upward. The meaningful change arrived around 11:19–11:20 AM, when green expansion candles lifted price toward 0.35.
* Base behavior: Repeated tests near 0.31–0.32 stopped short of revisiting the original signal.
* Participation: Volume generally contracted through the quieter range, then increased on the renewed advance.
* BULL FLAG-like pause: After reaching roughly 0.35–0.355, price consolidated mainly between 0.34 and 0.355 before resolving upward.
That final consolidation mattered. Red candles still appeared, but their selling pressure no longer forced price back into the earlier base.
For indicator-based confirmation, the relevant questions would have been whether price held above VWAP and a rising VWMA, and whether RSI recovered alongside the expansion. Those are analytical checks, not confirmed readings from this image.
The High of the Day
Around 11:30 AM, $SDA broke decisively out of the compact range. A large green candle advanced from approximately 0.344 to 0.386. The next candle extended the move, with its body finishing near 0.417 and its upper wick reaching 0.48 at 11:31 AM ET.
That was the HIGH OF DAY—and the completion of the +77.78% LONG MOVE measured from 0.27.
* PARABOLIC extension: Two consecutive expansion candles sharply increased the slope of the advance.
* Volume surge: Activity rose substantially above the immediately preceding consolidation.
* EXHAUSTION warning: The HIGH OF DAY candle left a long upper wick, showing that the highest prices were not sustained.
The next two candles were red, with price retreating toward 0.40. This follow-through strengthened the rejection signal: 0.48 was an intrabar extreme, not a closing plateau.
The wick and subsequent red bodies support an EXHAUSTION interpretation. They do not establish a specific RSI reading, bearish divergence, or the precise order-flow mechanism behind the reversal.
Technical Takeaway
The strongest lesson was the difference between expansion and acceptance.
The early thrust reached the 0.41–0.42 area but surrendered much of its progress. The later advance emerged from a tighter shelf around 0.34–0.355, accelerated through the intervening resistance, and briefly exceeded the earlier peak.
* The first surge demonstrated demand but also exposed substantial overhead supply.
* The extended rebuilding phase kept price above the original 0.27 reference despite repeated pullbacks.
* The late BREAKOUT paired wider candle bodies with renewed volume.
* The terminal upper wick warned that momentum had outrun sustained buying at the highs.
The arithmetic is straightforward: (0.48 − 0.27) ÷ 0.27 × 100 = 77.78%, rounded to two decimal places. That measures the signal-to-high opportunity, not an assumed realized return or guaranteed execution.
Final Word
$SDA’s move rewarded attention to changing structure: reversal first, failed extension second, rebuilding third, and a final vertical push that ended in visible rejection.
Pro Ticker’s 0.27 long signal provided the starting reference. The chart supplied the rest of the lesson: distinguish a range from a clean continuation pattern, watch volume return as compression resolves, and respect EXHAUSTION when a dramatic upper wick interrupts the advance.
Want real-time alerts from Pro Ticker? Download the Pro Ticker app. Stay on the Home page, keep refreshing the Home tab, and you'll see alerts in REAL TIME as we post them. Now you can also use our new Pro Ticker News Scanner to instantly track the latest market-moving headlines as they break. We start posting alerts every day in the pre-market before 9 a.m. ET.
DISCLAIMER
ProTickerSignals.com is owned and operated by Beyond Media Ltd (Collectively, the "Publisher", "we" or "us"). We are an advertising platform with the goal of building a thriving community. You can email us at: editor@protickersignals.com. We may receive payment for promoting public companies. Whenever we send out a paid promotion, we will notify our readers by including the word "Advertorial" at the top of the page and provide a detailed disclaimer about our compensation, who hired us, and the duration of the promotion.
For a full disclaimer and disclosure about our paid promotion read our full disclaimer here. Any non-compensated alerts are designed to expand our database for future financially compensated investor relations efforts. This message is part of a paid campaign. We will fully disclose our compensation, the company that engaged us, and the campaign's duration when we announce the ticker.
Daily Profile Picks. We would like to give you a clear understanding of our daily profile picks. Our picks are generated using several simple algorithmic criteria to identify stocks that are likely to experience significant intra-day movements. These movements can occur in either an upward or downward direction and are expected to take place within a single trading day. The percentage posted reflects a move from the price level provided to either the high or low of the day.
A percentage does not indicate or imply that a profit was made or that a trade was taken, and any results are purely hypothetical. These are statistics only, and do not reflect actual trades and you should not assume that you will achieve the same or similar results.
Signal prices are provided using pre market data, usually around 9 AM EST. This means that a Signal may happen before the market opens, and may actually be at a price that is not within the regular hour high and low of the day. You should therefore consider all prices that trade after our signal was posted. When we comment on a price move, be aware that this is calculated from the entry signal to the highest or lowest price traded afterwards, including premarket and after hours prices.
In all cases prices are within a single, and in some cases multi trading day.
It is important to note that we are not licensed investment advisors, and our ideas should not be construed as personalized investment advice. We are dedicated to providing you with interesting information and potential idea-based opportunities.
However, please remember that investing in the stock market carries significant risks. and, companies with low prices per share are particularly speculative and carry a high degree of risk. So, only invest what you are prepared to lose. It is crucial to conduct your own research and exercise prudent decision-making when making investment choices. We strongly encourage you to consult with a qualified financial professional or advisor who can assist you in tailoring your investment strategies to your specific needs and goals.
Thank you for being a part of ProTickerSignals.com , and we look forward to providing you with timely and informative profiles.
This Website and its owners, members, officers, directors and affiliates may own, or may buy and sell, securities of companies profiled here at any time before, during, or after distribution of information on the companies profiled.
Other Important Information. This communication is never to be used as the basis of making investment decisions and is for entertainment purposes only. At most, this communication should serve only as a starting point to do your own research and always consult with a licensed professional regarding the companies profiled and discussed. Conduct your own research. This is not a recommendation nor an offer to buy or sell securities.
By reading our newsletter and our website you agree to the terms of our disclaimer, which are subject to change at any time. By using our service, you agree not to hold Publisher, our site, its editor's, owners, or staff liable for any damages, financial or otherwise, that may occur due to any action you may take based on the information contained within our newsletters or on our website. We do not advise any reader to take any specific action. Again, investing in securities is highly risky and so only invest what you can afford to lose.
© Copyright 2024. All Rights Reserved.
© Copyright 2024. All Rights Reserved.