

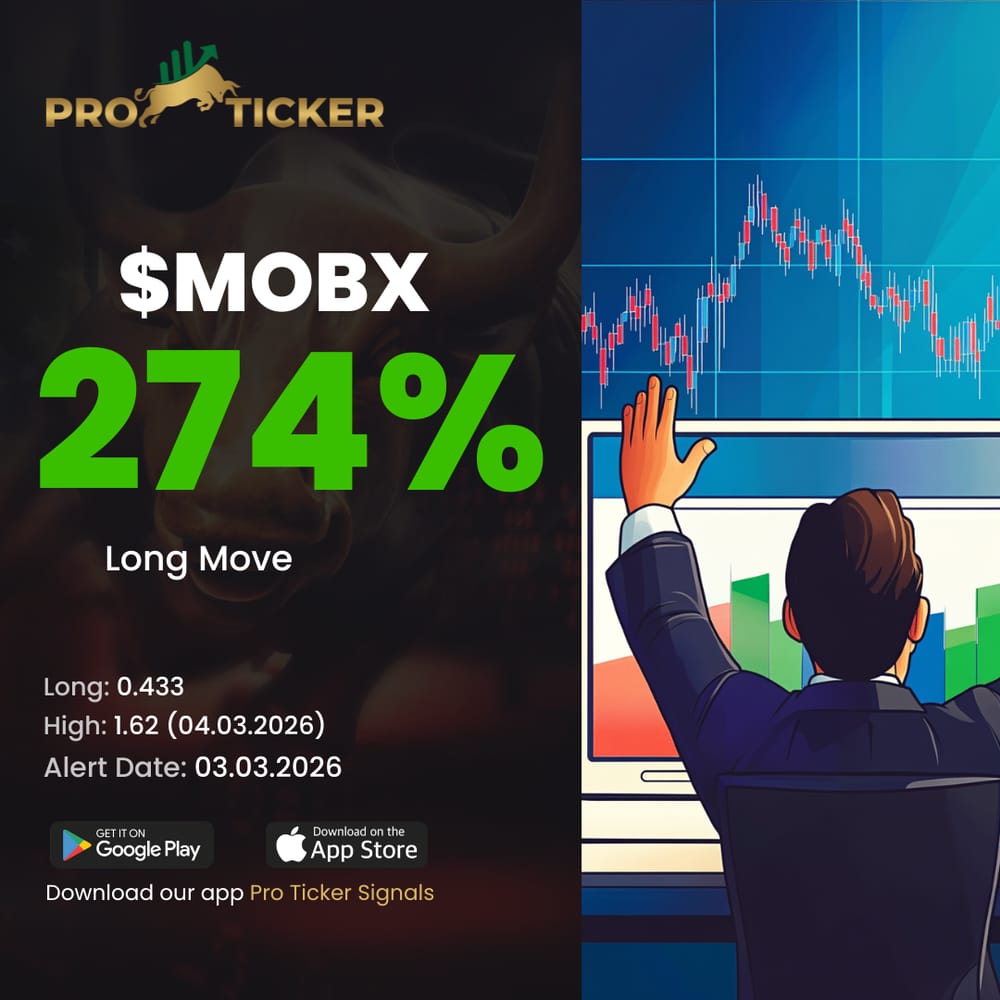
$MOBX — 274.1% LONG MOVE From 0.433 BREAKOUT to 1.62 Multi-Day HIGH OF DAY
Wednesday, March 04, 2026
Introduction
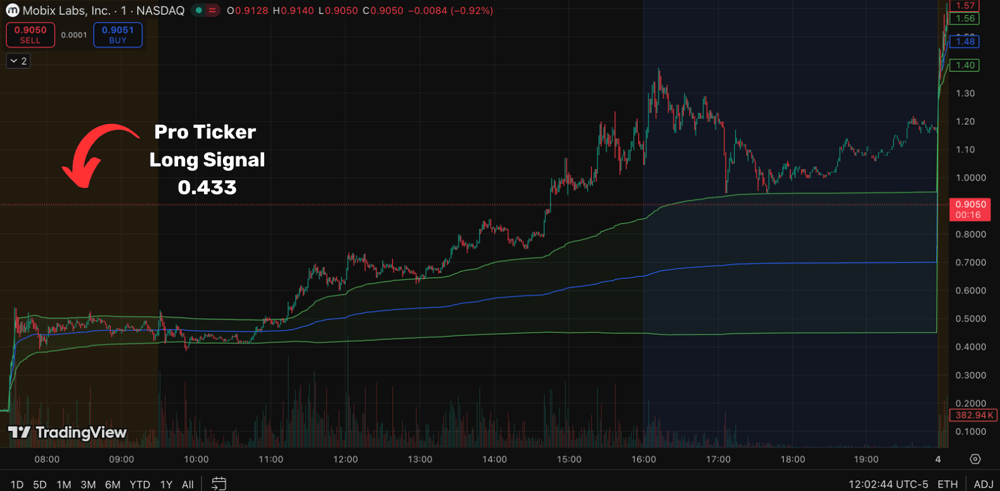
On Tuesday, March 3, 2026, Pro Ticker issued a LONG signal on $MOBX at 0.433. The initial expansion pushed the stock to a market-hours HIGH OF DAY at 1.24, followed by continued momentum into the after-hours where price reached 1.39, and ultimately extending to 1.62 the following day. From the original signal, the move completed an explosive 274.1% LONG MOVE.
What began as a technical BREAKOUT quickly evolved into a powerful multi-session trend supported by strong VWAP alignment, expanding RELATIVE VOLUME, and a final PARABOLIC continuation phase before exhaustion appeared near the highs.
The Setup
Before the LONG signal at 0.433, $MOBX had been trading in a tight compression structure.
The chart showed:
• A narrow consolidation range forming above support
• VWAP flattening as equilibrium developed
• VWMA slowly trending upward beneath price
• RELATIVE VOLUME beginning to increase
Price repeatedly tested the upper boundary of the range but failed to break immediately. Each dip toward VWAP was absorbed quickly, suggesting accumulation was taking place.
RSI remained stable in the mid-range but gradually began trending higher as buyers started stepping in.
The compression of volatility combined with rising support levels created the technical pressure necessary for a decisive BREAKOUT.
The Breakout
The BREAKOUT through 0.433 hit the Pro Ticker LONG signal and ignited the first expansion phase.
Immediately after the breakout:
• Large green candles pushed price through resistance
• VWAP flipped decisively into support
• VWMA began accelerating upward
• RELATIVE VOLUME surged
Tape behavior confirmed strong momentum:
• Stacked bids stepping higher
• Aggressive green prints lifting offers
• Sellers pulling liquidity above resistance
The first expansion leg carried price rapidly through 0.60, 0.80, and eventually toward the 1.00 region.
Despite the speed of the move, pullbacks remained shallow and repeatedly held above VWAP, forming the first BULL FLAG continuation structure.
This phase ultimately drove the stock to its intraday HIGH OF DAY at 1.24 during regular market hours.
The Pre-Market / After-Hours Surge
Momentum continued beyond regular trading hours.
During the after-hours session, $MOBX extended further, pushing to 1.39 as buyers continued stepping into the trend.
Technical behavior during this phase included:
• VWAP holding firmly as trend support
• VWMA steadily rising beneath price
• RELATIVE VOLUME expanding on each breakout attempt
• Tight consolidation structures forming micro BULL FLAGS
These flags repeatedly resolved into continuation pushes, creating a stair-step trend higher.
RSI remained elevated but periodically reset during small consolidations — a hallmark of sustained momentum.
By the following session, buyers drove the stock into a final PARABOLIC expansion phase.
The High of the Day
$MOBX ultimately reached its final HIGH OF DAY at 1.62, completing the full 274.1% LONG MOVE from the original 0.433 LONG signal.
At these elevated levels, classic EXHAUSTION signals began appearing.
Key warning signs included:
• Expanding upper wicks on breakout attempts
• Increased volatility near resistance
• RSI pushing into extreme overbought territory
Most importantly, heavy SELLING appeared on Level 2, confirming that the momentum phase was nearing completion.
Tape signals included:
• Large stacked offers appearing near 1.60+
• Red prints hitting bids into strength
• Breakout attempts repeatedly being absorbed
Each push toward new highs met immediate supply, signaling that the PARABOLIC expansion had entered its exhaustion phase.
Technical Takeaway
• LONG signal hit at 0.433
• Market-hours HIGH OF DAY 1.24
• After-hours continuation 1.39
• Final HIGH OF DAY 1.62
• Total expansion: 274.1% LONG MOVE
• Clean BREAKOUT from consolidation base
• VWAP and VWMA alignment supporting trend strength
• Multiple BULL FLAG continuation structures
• Strong RELATIVE VOLUME confirming participation
• Multi-session PARABOLIC expansion
• RSI strength throughout the trend
• EXHAUSTION confirmed by heavy SELLING on Level 2
This move demonstrated how a well-structured BREAKOUT can evolve into a powerful multi-session runner when momentum, volume, and VWAP trend structure align.
Final Word
“Want real-time alerts from Pro Ticker? Download the Pro Ticker app. Stay on the Home page, keep refreshing the Home tab, and you’ll see alerts in REAL TIME as we post them. Now you can also use our new Pro Ticker News Scanner to instantly track the latest market-moving headlines as they break. We start posting alerts every day in the pre-market before 9 a.m. ET.”
Term of Use/DISCLAIMER
ProTickerSignals.com is owned and operated by Beyond Media Ltd (Collectively, the “Publisher”, “we” or “us”). We are an advertising platform with the goal of building a thriving community. You can email us at: editor@protickersignals.com. We may receive payment for promoting public companies. Whenever we send out a paid promotion, we will notify our readers by including the word "Advertorial" at the top of the page and provide a detailed disclaimer about our compensation, who hired us, and the duration of the promotion. For a full disclaimer and disclosure about our paid promotion read our full disclaimer here. Any non-compensated alerts are designed to expand our database for future financially compensated investor relations efforts.
Daily Profile Picks. We would like to give you a clear understanding of our daily profile picks. Our picks are generated using several simple algorithmic criteria to identify stocks that are likely to experience significant intra-day movements. These movements can occur in either an upward or downward direction and are expected to take place within a single trading day. The percentage posted reflects a move from the price level provided to either the high or low of the day.
A percentage does not indicate or imply that a profit was made or that a trade was taken, and any results are purely hypothetical. These are statistics only, and do not reflect actual trades and you should not assume that you will achieve the same or similar results.
Signal prices are provided using pre market data, usually around 9 AM EST. This means that a Signal may happen before the market opens, and may actually be at a price that is not within the regular hour high and low of the day. You should therefore consider all prices that trade after our signal was posted. When we comment on a price move, be aware that this is calculated from the entry signal to the highest or lowest price traded afterwards, including premarket and after hours prices. In all cases prices are within a single, and in some cases multi trading day.
It is important to note that we are not licensed investment advisors, and our ideas should not be construed as personalized investment advice. We are dedicated to providing you with interesting information and potential idea-based opportunities.
However, please remember that investing in the stock market carries significant risks. and, companies with low prices per share are particularly speculative and carry a high degree of risk. So, only invest what you are prepared to lose. It is crucial to conduct your own research and exercise prudent decision-making when making investment choices. We strongly encourage you to consult with a qualified financial professional or advisor who can assist you in tailoring your investment strategies to your specific needs and goals.
Thank you for being a part of ProTickerSignals.com , and we look forward to providing you with timely and informative profiles.
This Website and its owners, members, officers, directors and affiliates may own, or may buy and sell, securities of companies profiled here at any time before, during, or after distribution of information on the companies profiled.
Other Important Information. This communication is never to be used as the basis of making investment decisions and is for entertainment purposes only. At most, this communication should serve only as a starting point to do your own research and always consult with a licensed professional regarding the companies profiled and discussed. Conduct your own research. This is not a recommendation nor an offer to buy or sell securities.
By reading our newsletter and our website you agree to the terms of our disclaimer, which are subject to change at any time. By using our service, you agree not to hold Publisher, our site, its editor’s, owners, or staff liable for any damages, financial or otherwise, that may occur due to any action you may take based on the information contained within our newsletters or on our website. We do not advise any reader to take any specific action. Again, investing in securities is highly risky and so only invest what you can afford to lose.
DISCLAIMER
ProTickerSignals.com is owned and operated by Beyond Media Ltd (Collectively, the “Publisher”, “we” or “us”). We are an advertising platform with the goal of building a thriving community. You can email us at: editor@protickersignals.com. We may receive payment for promoting public companies. Whenever we send out a paid promotion, we will notify our readers by including the word "Advertorial" at the top of the page and provide a detailed disclaimer about our compensation, who hired us, and the duration of the promotion. For a full disclaimer and disclosure about our paid promotion read our full disclaimer here. Any non-compensated alerts are designed to expand our database for future financially compensated investor relations efforts.
Daily Profile Picks. We would like to give you a clear understanding of our daily profile picks. Our picks are generated using several simple algorithmic criteria to identify stocks that are likely to experience significant intra-day movements. These movements can occur in either an upward or downward direction and are expected to take place within a single trading day. The percentage posted reflects a move from the price level provided to either the high or low of the day.
A percentage does not indicate or imply that a profit was made or that a trade was taken, and any results are purely hypothetical. These are statistics only, and do not reflect actual trades and you should not assume that you will achieve the same or similar results.
Signal prices are provided using pre market data, usually around 9 AM EST. This means that a Signal may happen before the market opens, and may actually be at a price that is not within the regular hour high and low of the day. You should therefore consider all prices that trade after our signal was posted. When we comment on a price move, be aware that this is calculated from the entry signal to the highest or lowest price traded afterwards, including premarket and after hours prices. In all cases prices are within a single, and in some cases multi trading day.
It is important to note that we are not licensed investment advisors, and our ideas should not be construed as personalized investment advice. We are dedicated to providing you with interesting information and potential idea-based opportunities.
However, please remember that investing in the stock market carries significant risks. and, companies with low prices per share are particularly speculative and carry a high degree of risk. So, only invest what you are prepared to lose. It is crucial to conduct your own research and exercise prudent decision-making when making investment choices. We strongly encourage you to consult with a qualified financial professional or advisor who can assist you in tailoring your investment strategies to your specific needs and goals.
Thank you for being a part of ProTickerSignals.com , and we look forward to providing you with timely and informative profiles.
This Website and its owners, members, officers, directors and affiliates may own, or may buy and sell, securities of companies profiled here at any time before, during, or after distribution of information on the companies profiled.
Other Important Information. This communication is never to be used as the basis of making investment decisions and is for entertainment purposes only. At most, this communication should serve only as a starting point to do your own research and always consult with a licensed professional regarding the companies profiled and discussed. Conduct your own research. This is not a recommendation nor an offer to buy or sell securities.
By reading our newsletter and our website you agree to the terms of our disclaimer, which are subject to change at any time. By using our service, you agree not to hold Publisher, our site, its editor’s, owners, or staff liable for any damages, financial or otherwise, that may occur due to any action you may take based on the information contained within our newsletters or on our website. We do not advise any reader to take any specific action. Again, investing in securities is highly risky and so only invest what you can afford to lose.
© Copyright 2024. All Rights Reserved.
© Copyright 2024. All Rights Reserved.