

The Stair-Step Breakout That Sent $LHSW Into a +110.81% LONG MOVE
Tuesday, September 22, 2026

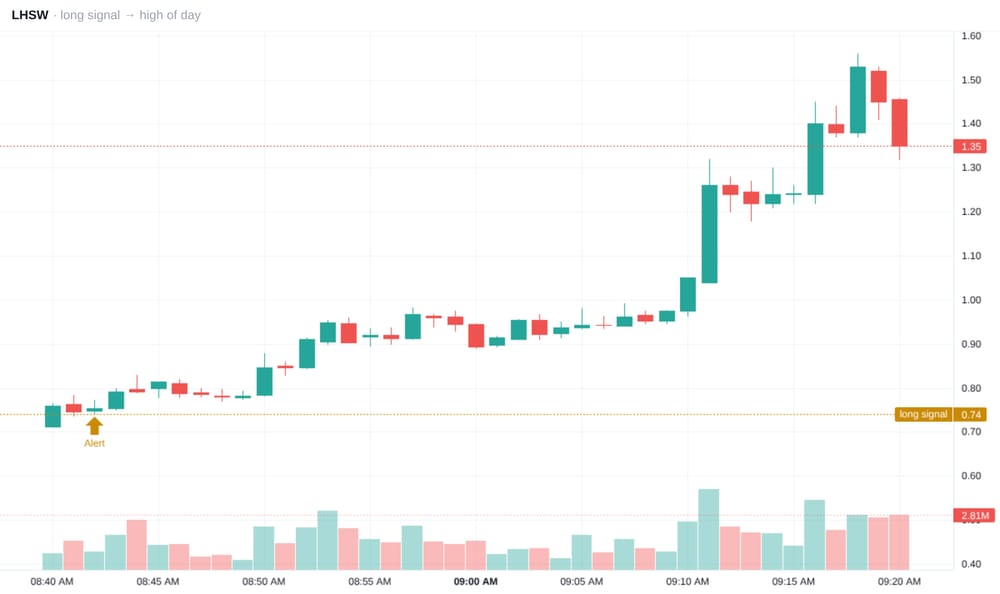
At 8:42 AM ET on Tuesday, September 22, 2026, Pro Ticker posted a $LHSW long signal at 0.74. What followed was a technically clean pre-market sequence: higher lows, controlled pauses, expanding green candles, and repeated RELATIVE VOLUME surges. By 9:18 AM ET, $LHSW had printed a HIGH OF DAY of 1.56, completing a +110.81% LONG MOVE from the signal.
The Setup
The chart opened with $LHSW trading near the low 0.70s. A strong green candle lifted price through 0.74, and the next few candles tested the breakout area without producing a meaningful breakdown.
At the 8:42 AM ET long signal, the critical information was not just the price. It was the way the candles behaved around that level. Sellers briefly pressed into the move, but the red candles remained compact and failed to erase the initial expansion.
* The 0.74 long signal sat near the base of the developing intraday uptrend.
* Early pullbacks held around the mid-0.70s instead of collapsing beneath the signal.
* Green candles began closing progressively higher, establishing a staircase of higher highs and higher lows.
* Price action was consistent with $LHSW holding above rising short-term VWAP and VWMA references as momentum strengthened.
* RELATIVE VOLUME expanded during the advancing candles and contracted during several pauses—a constructive momentum signature.
* RSI would have accelerated with the first impulse, cooled during the shallow pullbacks, and then re-expanded as buyers reclaimed control.
On Level 2, the key bullish behavior was the appearance of stacked bids beneath price. Offers were being tested repeatedly, while dips attracted buyers before they could develop into deeper red candles.
The Breakout
Between approximately 8:43 AM and 8:50 AM ET, $LHSW moved through the upper 0.70s and began challenging 0.80. The progression was methodical: a push, a small red candle, another push, and another shallow pause.
Near 8:50 AM ET, a broad green candle opened the next phase. Price drove from the upper 0.70s into the low 0.80s, followed by a brief pause and another expansion toward 0.90.
* The first BREAKOUT carried $LHSW through the 0.80 area.
* Small-bodied red candles failed to create sustained downside follow-through.
* Buyers repeatedly defended higher levels, keeping price extended above the earlier base.
* The VWMA would have steepened as newer, higher-volume candles entered its calculation.
* Price separation above VWAP increased without immediately producing a full mean-reversion event.
* Volume expanded behind the strongest green candles, confirming that the move was being supported by participation rather than thin, isolated prints.
By roughly 8:53 AM ET, $LHSW had reached the mid-0.90s. A red candle then pulled price back toward the low 0.90s, but the decline remained orderly. Instead of unraveling, the stock started building a broad consolidation between approximately 0.90 and 0.97.
That area became the chart’s central BULL FLAG. The candles tightened, wicks appeared on both sides, and neither isolated red prints nor brief selling pressure could force price back toward the original signal.
The Pre-Market Surge
From around 8:54 AM through 9:09 AM ET, $LHSW compressed beneath 1.00. This was the quietest but most technically important portion of the move.
The stock repeatedly probed the mid-to-upper 0.90s, dipped toward 0.90, and recovered. Candle bodies narrowed as the range tightened. The structure showed supply being absorbed before the next major expansion.
* The BULL FLAG held well above the 0.74 long signal.
* Pullbacks continued to produce higher support relative to the original base.
* VWAP and VWMA positioning remained constructive, with price spending the consolidation above the earlier volume-weighted value zone.
* RSI likely reset from its initial momentum peak without losing the broader bullish regime.
* RELATIVE VOLUME temporarily moderated during compression, then surged as price attacked 1.00.
* Level 2 bids continued stepping upward while offers near the psychological 1.00 level were gradually absorbed.
At approximately 9:10 AM ET, the compression resolved. A green candle pushed through 1.00 and closed around the mid-1.00s. The next candle delivered the chart’s most aggressive expansion to that point, launching from roughly 1.04 into the mid-1.20s and briefly probing above 1.30.
This was the transition from an orderly trend into a PARABOLIC phase.
The volume histogram confirmed the change. RELATIVE VOLUME surged sharply beneath the breakout candles, showing that participation increased as price cleared the long consolidation. $LHSW then paused between approximately 1.20 and 1.26, printing two controlled red candles followed by compact stabilization.
Rather than immediately filling the breakout candle, the stock held most of its gain.
* The pullback respected the low-1.20 area.
* Red candle bodies stayed relatively contained compared with the preceding green expansion.
* A small green recovery candle showed that buyers were still responsive.
* A narrow-bodied candle near 1.24 reflected temporary equilibrium before the next impulse.
* Stacked bids and renewed offer lifting prepared the tape for another BREAKOUT.
Around 9:16 AM ET, another large green candle drove $LHSW from the mid-1.20s to approximately 1.40. After a brief red pause, the final momentum candle accelerated through 1.50.
The High of the Day
At 9:18 AM ET, $LHSW printed its HIGH OF DAY at 1.56. The candle extended above 1.50, leaving an upper wick as buyers met a sudden wall of supply.
This was the point where the character of the tape changed. The ascent had become vertically extended from VWAP and VWMA, RSI dynamics were consistent with an extreme overbought reading, and the final push arrived after two major RELATIVE VOLUME expansions.
Most importantly, heavy SELLING appeared on Level 2 and supplied the EXHAUSTION signal.
* Offers became heavier near the top of the move.
* Large SELLING interest absorbed aggressive market buys.
* Stacked bids became less effective as red prints accelerated through the tape.
* The HIGH OF DAY candle’s upper wick showed rejection above 1.50.
* The next candle turned red and pulled back toward the mid-1.40s.
* A larger red candle then drove price toward 1.35, confirming that momentum had shifted from expansion to distribution.
The increasing red volume after the peak mattered. Earlier red candles had been pauses inside the trend; after 1.56, selling pressure produced wider bodies and deeper retracement. That contrast distinguished ordinary consolidation from true PARABOLIC EXHAUSTION.
Technical Takeaway
The $LHSW chart demonstrated how a major pre-market move can develop through several separate technical phases rather than one uninterrupted spike.
First came acceptance above the 0.74 long signal. Then came the staircase through 0.80 and 0.90. Next, a prolonged BULL FLAG formed beneath 1.00. Once that resistance gave way on expanding RELATIVE VOLUME, price entered a PARABOLIC sequence that carried it through 1.25, 1.40, and ultimately 1.56.
* Strong candles expanded on heavier volume.
* Pullbacks generally occurred on controlled candle bodies before the final top.
* VWAP and VWMA acted as directional references as price built distance above weighted value.
* RSI expanded during each impulse and cooled during consolidation, until the last extension became unsustainably stretched.
* The 1.00 BREAKOUT converted a long compression into rapid price discovery.
* Heavy SELLING on Level 2 near 1.56 marked the clearest EXHAUSTION signal.
* The post-HIGH OF DAY red candles confirmed that sellers had finally interrupted the higher-low sequence.
From the 0.74 long signal to the 1.56 HIGH OF DAY, $LHSW delivered a +110.81% LONG MOVE in approximately 36 minutes.
Final Word
$LHSW rewarded attention to structure. The early candles defended the signal, the middle of the chart built a disciplined BULL FLAG, and the late-stage RELATIVE VOLUME surge powered a PARABOLIC expansion. Just as importantly, the reversal from 1.56 showed why traders must monitor candle rejection, RSI extension, distance from VWAP and VWMA, red prints, and changing Level 2 liquidity as a move matures.
The opportunity began at 0.74, but the chart told the full story candle by candle: acceptance, BREAKOUT, consolidation, expansion, and finally EXHAUSTION at the HIGH OF DAY.
Want real-time alerts from Pro Ticker? Download the Pro Ticker app. Stay on the Home page, keep refreshing the Home tab, and you'll see alerts in REAL TIME as we post them. Now you can also use our new Pro Ticker News Scanner to instantly track the latest market-moving headlines as they break. We start posting alerts every day in the pre-market before 9 a.m. ET.
DISCLAIMER
ProTickerSignals.com is owned and operated by Beyond Media Group LLC, Beyond Media Ltd (Collectively, the "Publisher", "we" or "us"). We are an advertising platform with the goal of building a thriving community. You can email us at: editor@protickersignals.com. We may receive payment for promoting public companies. Whenever we send out a paid promotion, we will notify our readers by including the word "Advertorial" at the top of the page and provide a detailed disclaimer about our compensation, who hired us, and the duration of the promotion.
For a full disclaimer and disclosure about our paid promotion read our full disclaimer here. Any non-compensated alerts are designed to expand our database for future financially compensated investor relations efforts. This message is part of a paid campaign. We will fully disclose our compensation, the company that engaged us, and the campaign's duration when we announce the ticker.
Daily Profile Picks. We would like to give you a clear understanding of our daily profile picks. Our picks are generated using several simple algorithmic criteria to identify stocks that are likely to experience significant intra-day movements. These movements can occur in either an upward or downward direction and are expected to take place within a single trading day. The percentage posted reflects a move from the price level provided to either the high or low of the day.
A percentage does not indicate or imply that a profit was made or that a trade was taken, and any results are purely hypothetical. These are statistics only, and do not reflect actual trades and you should not assume that you will achieve the same or similar results.
Signal prices are provided using pre market data, usually around 9 AM EST. This means that a Signal may happen before the market opens, and may actually be at a price that is not within the regular hour high and low of the day. You should therefore consider all prices that trade after our signal was posted. When we comment on a price move, be aware that this is calculated from the entry signal to the highest or lowest price traded afterwards, including premarket and after hours prices.
In all cases prices are within a single, and in some cases multi trading day.
It is important to note that we are not licensed investment advisors, and our ideas should not be construed as personalized investment advice. We are dedicated to providing you with interesting information and potential idea-based opportunities.
However, please remember that investing in the stock market carries significant risks. and, companies with low prices per share are particularly speculative and carry a high degree of risk. So, only invest what you are prepared to lose. It is crucial to conduct your own research and exercise prudent decision-making when making investment choices. We strongly encourage you to consult with a qualified financial professional or advisor who can assist you in tailoring your investment strategies to your specific needs and goals.
Thank you for being a part of ProTickerSignals.com , and we look forward to providing you with timely and informative profiles.
This Website and its owners, members, officers, directors and affiliates may own, or may buy and sell, securities of companies profiled here at any time before, during, or after distribution of information on the companies profiled.
Other Important Information. This communication is never to be used as the basis of making investment decisions and is for entertainment purposes only. At most, this communication should serve only as a starting point to do your own research and always consult with a licensed professional regarding the companies profiled and discussed. Conduct your own research. This is not a recommendation nor an offer to buy or sell securities.
By reading our newsletter and our website you agree to the terms of our disclaimer, which are subject to change at any time. By using our service, you agree not to hold Publisher, our site, its editor's, owners, or staff liable for any damages, financial or otherwise, that may occur due to any action you may take based on the information contained within our newsletters or on our website. We do not advise any reader to take any specific action. Again, investing in securities is highly risky and so only invest what you can afford to lose.
© Copyright 2024. All Rights Reserved.
© Copyright 2024. All Rights Reserved.