

$GWH Rockets 347% After Pre-Market Long Trigger — A Textbook Technical Explosion
Tuesday, October 14, 2025
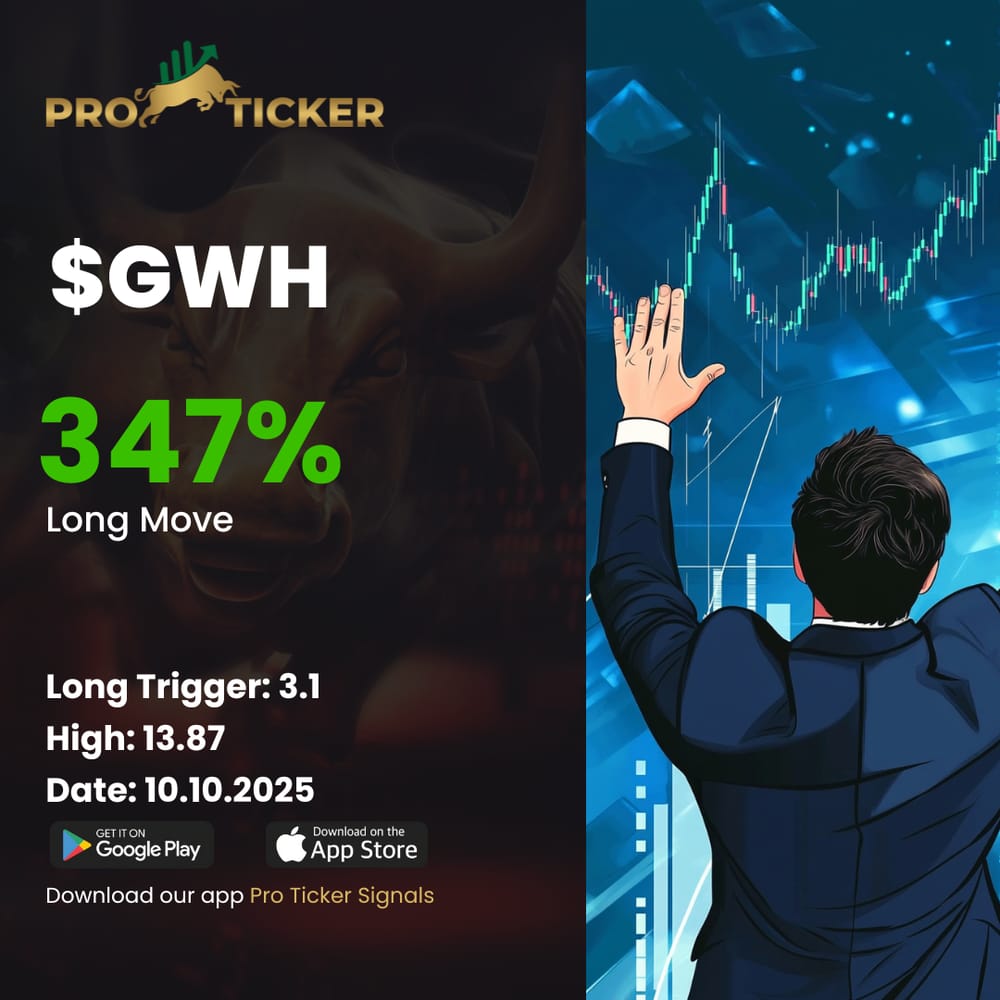
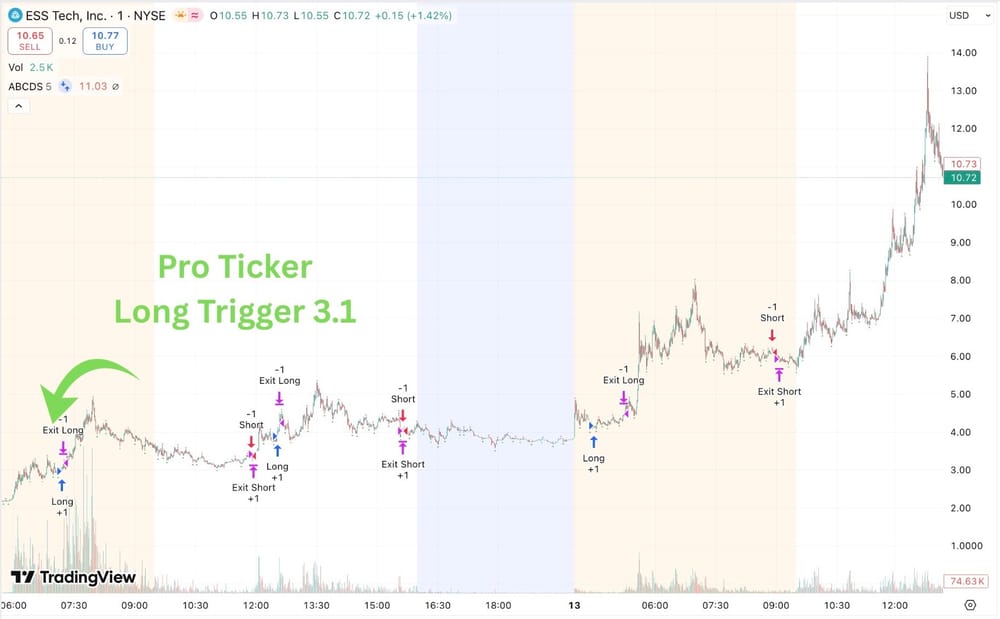
On Friday October 10th, 2025, ProTicker issued a LONG TRIGGER for ESS Tech, Inc. ($GWH) with a trigger at 3.10 in pre-market. What followed was nothing short of a textbook technical BLUEPRINT — a clean setup that evolved into a 347.4% LONG MOVE, topping out at 4.89 intraday on October 10th and pushing even further to 13.87 on Monday October 13th 2025. The move was steep, surgical, and perfectly aligned with the rules of momentum and breakout trading.
The Setup
Leading into the alert, $GWH had been compressing under its VWAP with tight consolidation candles between 2.80 and 3.00. Volume was muted, but RELATIVE VOLUME metrics quietly hinted at accumulation. The VWMA began to flatten, then curl upward, signaling the first momentum rotation in days.
The RSI, which had been oscillating below 45, started climbing toward the neutral 50 mark as pre-market liquidity thickened. On Level 2, stacked bids appeared at 3.05–3.10 — a key psychological area that mirrored prior intraday resistance. This precise alignment was the technical coil ProTicker looks for before a confirmed BREAKOUT.
At 3.1, the LONG TRIGGER activated. Within minutes, momentum traders were onboard, and the tape turned aggressive. The pre-market structure had officially shifted from compression to expansion.
The Breakout
Once the bell rang, volume exploded — over 10x the 20-day average. The first one-minute candle pierced above the VWAP with conviction, confirming the BREAKOUT. The next series of candles stacked higher, each closing above the prior wick’s high — a classic BULL FLAG continuation pattern.
Traders saw perfect symmetry between price action and momentum indicators: RSI surged through 70, VWMA separated cleanly above VWAP, and RELATIVE VOLUME kept accelerating past 4.0x. On Level 2, aggressive green prints dominated, reflecting buyers chasing liquidity through the ask. Every dip toward VWAP was instantly absorbed — a clear sign that the smart money was still accumulating.
The stock moved in measured pulses, respecting Fibonacci retracements and confirming each base before pushing higher. This was a mechanical breakout, following a technical BLUEPRINT to precision.
The Pre-Market Surge
By the late pre-market session, $GWH had already put in an extraordinary run from 3.10 to 4.89, marking a 57% pre-market LONG MOVE before the open. The VWAP held tightly beneath price action — acting as the perfect trailing support line — while VWMA showed strong upward curvature.
Each micro-pullback created a staircase pattern that confirmed trend sustainability. RSI printed above 80 but maintained consistency, showing that the move was PARABOLIC but not yet EXHAUSTED.
This phase of the move reflected a textbook momentum rotation, where early buyers in pre-market held size and fresh traders joined at the bell, fueling continuation volume. Every dip below 4.50 was met with stacked bids, and the Level 2 order flow confirmed overwhelming demand pressure.
The High of the Day
The stock hit its HIGH OF DAY at 4.89 before midday, pausing under heavy Level 2 selling pressure. Red prints began flashing consistently — the first true sign of EXHAUSTION. The order book thinned, and the tape revealed sellers hitting the bid in larger lots.
Momentum indicators flashed warning signals: RSI hovered in the overbought 88–92 zone, and the VWMA began flattening against the parabolic curvature. Short-term traders started exiting positions as momentum waned. This is where the EXHAUSTION phase was confirmed.
But the story didn’t end there. After consolidating over the weekend, $GWH reignited on October 13th, breaking into a second-wave PARABOLIC RUN that extended the total LONG MOVE to 347.4%, with a peak at 13.87.
It was a flawless demonstration of how strong continuation can occur when the technical BLUEPRINT is followed candle by candle.
Technical Takeaway
The $GWH run was a masterclass in structured momentum. From the LONG TRIGGER at 3.10 to the HIGH OF DAY at 13.87 and beyond, every technical element lined up:
- VWAP & VWMA alignment: Confirmed trend structure throughout the breakout.
- RELATIVE VOLUME: Sustained above 3.5x for the entire session — a hallmark of institutional interest.
- RSI behavior: Clean progression from 50 to 90 with no bearish divergence until exhaustion.
- Level 2 dynamics: Stacked bids pre-breakout, heavy green prints on breakout, red prints into exhaustion.
- Pattern formation: Clear bull flag continuation leading into parabolic extension.
Every indicator played its role within the framework — from the early VWAP reclaim to the late-stage parabolic climax. This was the blueprint move traders dream of catching in real time.
Final Word
$GWH delivered a stunning 347.4% LONG MOVE, driven by precise technical confluence and disciplined momentum behavior. From a 3.10 trigger to a 13.87 top, the move embodied the essence of ProTicker’s real-time alert methodology — early identification, clear confirmation, and timely awareness of exhaustion.
Want to get real-time alerts from ProTicker? Download the ProTicker app. Stay on the Home page and on the Home tab and keep refreshing it to see alerts in REAL-TIME as we post them. We start posting alerts every day in the pre-market before 9 a.m. ET.
Term of Use/DISCLAIMER
ProTickerSignals.com is owned and operated by Beyond Media Ltd (Collectively, the “Publisher”, “we” or “us”). We are an advertising platform with the goal of building a thriving community. You can email us at: editor@protickersignals.com. We may receive payment for promoting public companies. Whenever we send out a paid promotion, we will notify our readers by including the word "Advertorial" at the top of the page and provide a detailed disclaimer about our compensation, who hired us, and the duration of the promotion. For a full disclaimer and disclosure about our paid promotion read our full disclaimer here. Any non-compensated alerts are designed to expand our database for future financially compensated investor relations efforts.
Daily Profile Picks. We would like to give you a clear understanding of our daily profile picks. Our picks are generated using several simple algorithmic criteria to identify stocks that are likely to experience significant intra-day movements. These movements can occur in either an upward or downward direction and are expected to take place within a single trading day. The percentage posted reflects a move from the price level provided to either the high or low of the day.
A percentage does not indicate or imply that a profit was made or that a trade was taken, and any results are purely hypothetical. These are statistics only, and do not reflect actual trades and you should not assume that you will achieve the same or similar results.
Signal prices are provided using pre market data, usually around 9 AM EST. This means that a Signal may happen before the market opens, and may actually be at a price that is not within the regular hour high and low of the day. You should therefore consider all prices that trade after our signal was posted. When we comment on a price move, be aware that this is calculated from the entry signal to the highest or lowest price traded afterwards, including premarket and after hours prices. In all cases prices are within a single, and in some cases multi trading day.
It is important to note that we are not licensed investment advisors, and our ideas should not be construed as personalized investment advice. We are dedicated to providing you with interesting information and potential idea-based opportunities.
However, please remember that investing in the stock market carries significant risks. and, companies with low prices per share are particularly speculative and carry a high degree of risk. So, only invest what you are prepared to lose. It is crucial to conduct your own research and exercise prudent decision-making when making investment choices. We strongly encourage you to consult with a qualified financial professional or advisor who can assist you in tailoring your investment strategies to your specific needs and goals.
Thank you for being a part of ProTickerSignals.com , and we look forward to providing you with timely and informative profiles.
This Website and its owners, members, officers, directors and affiliates may own, or may buy and sell, securities of companies profiled here at any time before, during, or after distribution of information on the companies profiled.
Other Important Information. This communication is never to be used as the basis of making investment decisions and is for entertainment purposes only. At most, this communication should serve only as a starting point to do your own research and always consult with a licensed professional regarding the companies profiled and discussed. Conduct your own research. This is not a recommendation nor an offer to buy or sell securities.
By reading our newsletter and our website you agree to the terms of our disclaimer, which are subject to change at any time. By using our service, you agree not to hold Publisher, our site, its editor’s, owners, or staff liable for any damages, financial or otherwise, that may occur due to any action you may take based on the information contained within our newsletters or on our website. We do not advise any reader to take any specific action. Again, investing in securities is highly risky and so only invest what you can afford to lose.
DISCLAIMER
ProTickerSignals.com is owned and operated by Beyond Media Ltd (Collectively, the “Publisher”, “we” or “us”). We are an advertising platform with the goal of building a thriving community. You can email us at: editor@protickersignals.com. We may receive payment for promoting public companies. Whenever we send out a paid promotion, we will notify our readers by including the word "Advertorial" at the top of the page and provide a detailed disclaimer about our compensation, who hired us, and the duration of the promotion. For a full disclaimer and disclosure about our paid promotion read our full disclaimer here. Any non-compensated alerts are designed to expand our database for future financially compensated investor relations efforts.
Daily Profile Picks. We would like to give you a clear understanding of our daily profile picks. Our picks are generated using several simple algorithmic criteria to identify stocks that are likely to experience significant intra-day movements. These movements can occur in either an upward or downward direction and are expected to take place within a single trading day. The percentage posted reflects a move from the price level provided to either the high or low of the day.
A percentage does not indicate or imply that a profit was made or that a trade was taken, and any results are purely hypothetical. These are statistics only, and do not reflect actual trades and you should not assume that you will achieve the same or similar results.
Signal prices are provided using pre market data, usually around 9 AM EST. This means that a Signal may happen before the market opens, and may actually be at a price that is not within the regular hour high and low of the day. You should therefore consider all prices that trade after our signal was posted. When we comment on a price move, be aware that this is calculated from the entry signal to the highest or lowest price traded afterwards, including premarket and after hours prices. In all cases prices are within a single, and in some cases multi trading day.
It is important to note that we are not licensed investment advisors, and our ideas should not be construed as personalized investment advice. We are dedicated to providing you with interesting information and potential idea-based opportunities.
However, please remember that investing in the stock market carries significant risks. and, companies with low prices per share are particularly speculative and carry a high degree of risk. So, only invest what you are prepared to lose. It is crucial to conduct your own research and exercise prudent decision-making when making investment choices. We strongly encourage you to consult with a qualified financial professional or advisor who can assist you in tailoring your investment strategies to your specific needs and goals.
Thank you for being a part of ProTickerSignals.com , and we look forward to providing you with timely and informative profiles.
This Website and its owners, members, officers, directors and affiliates may own, or may buy and sell, securities of companies profiled here at any time before, during, or after distribution of information on the companies profiled.
Other Important Information. This communication is never to be used as the basis of making investment decisions and is for entertainment purposes only. At most, this communication should serve only as a starting point to do your own research and always consult with a licensed professional regarding the companies profiled and discussed. Conduct your own research. This is not a recommendation nor an offer to buy or sell securities.
By reading our newsletter and our website you agree to the terms of our disclaimer, which are subject to change at any time. By using our service, you agree not to hold Publisher, our site, its editor’s, owners, or staff liable for any damages, financial or otherwise, that may occur due to any action you may take based on the information contained within our newsletters or on our website. We do not advise any reader to take any specific action. Again, investing in securities is highly risky and so only invest what you can afford to lose.
© Copyright 2024. All Rights Reserved.
© Copyright 2024. All Rights Reserved.