

$CAST 564.9% LONG MOVE: The Technical Setup Behind the Monster Run
Monday, June 15, 2026

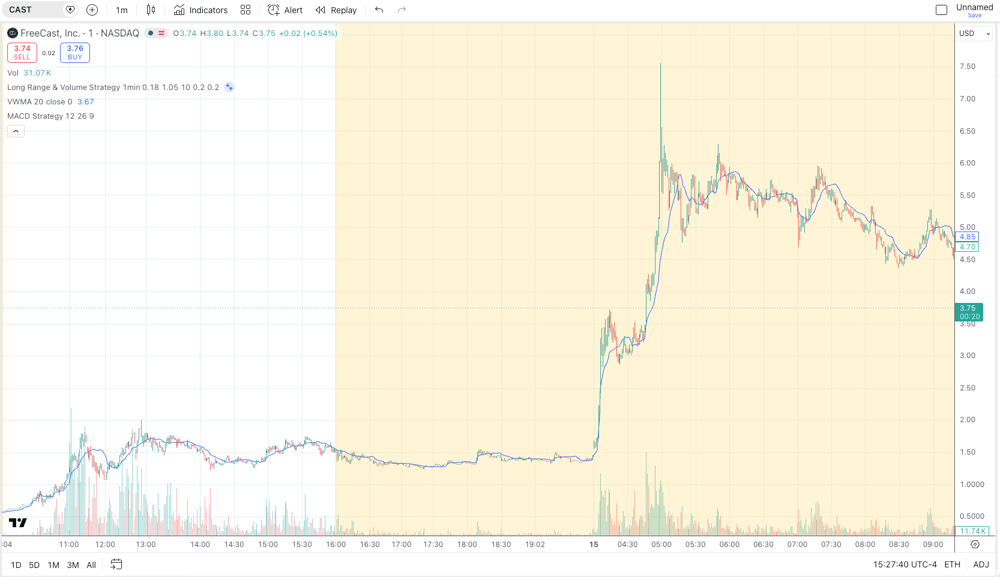
$CAST turned into a textbook multi-day continuation story after Pro Ticker posted a 1.14 long signal on Friday, June 12, 2026. The alert first pushed to 2.00 on Friday, marking a 75.4% LONG MOVE in a single session. But the chart did not stop there. By Monday pre-market, $CAST continued its run and reached a HIGH OF DAY at 7.58, extending the move to a massive 564.9% LONG MOVE from the original long signal.
The Setup
The $CAST setup started with price action building quietly around the lower range before buyers began stepping in with stronger candle expansion. The early structure showed a controlled grind rather than an immediate blow-off, which is often where the real opportunity begins to form.
Around the 1.14 long signal area, the chart began showing the first signs of a technical shift. Candles started holding above key short-term moving average pressure, and the VWMA began curling upward as volume started confirming buyer interest. That matters because when price begins holding above the VWAP/VWMA zone while volume expands, it often signals that momentum traders are starting to control the tape.
Friday’s move toward 2.00 was important because it created the first major expansion leg. That run gave $CAST a 75.4% LONG MOVE in one day, but more importantly, it established the stock as a name with strong RELATIVE VOLUME, emotional momentum, and multi-day continuation potential.
The Breakout
The BREAKOUT phase came when $CAST moved away from the 1.14 area and began printing stronger candles with wider bodies and shorter lower wicks. That candle behavior showed buyers absorbing dips and refusing to let the chart break back into its previous base.
As the move developed, the VWMA began acting like a momentum guide. Instead of price constantly rejecting from the moving average, candles started riding above it. That is one of the cleaner technical clues on a fast-moving low-float style chart: when price holds above the rising VWMA, every pullback becomes a test of demand.
The tape likely started to show more aggressive buying as bids stacked underneath key intraday levels. When Level 2 begins showing stacked bids and fewer sellers willing to hit the bid, price can start walking up quickly. That is where the breakout shifts from a simple move into a momentum expansion.
The first surge into 2.00 on Friday was not just a random spike. It was the market repricing the chart after the original long signal. The volume expansion, candle strength, and clean hold above short-term moving average support helped create the foundation for the next leg.
The Pre-Market Surge
Monday pre-market is where $CAST turned from a strong Friday alert into a true multi-day runner. The stock opened the new session with elevated RELATIVE VOLUME, and the chart quickly started building above the previous Friday range.
This is where the technical story became even more aggressive. Instead of fading after Friday’s move, $CAST began forming continuation candles in pre-market, holding higher levels and refusing to fully unwind. That showed buyers were still active even after the initial 75.4% LONG MOVE.
As the move accelerated, the chart entered a PARABOLIC phase. Candles expanded quickly, pullbacks became shallow, and the distance between price and the VWMA widened. This is usually where momentum becomes emotional. Traders who missed the first move often chase the second move, while shorts who expected a fade may get forced to cover into strength.
During this type of pre-market surge, RSI dynamics typically shift into extreme momentum territory. That does not automatically mean the move is over, but it does signal that the chart is becoming stretched. The stronger the price separates from VWAP/VWMA support, the more important it becomes to watch for EXHAUSTION candles and tape weakness.
The High of the Day
The Monday pre-market extension ultimately pushed $CAST to a HIGH OF DAY at 7.58, completing a massive 564.9% LONG MOVE from the original 1.14 long signal.
That final extension had the look of a stretched momentum move. Price had already traveled far above the original base, and the candles were moving in a much more vertical pattern. When a chart goes PARABOLIC like this, the same strength that makes the move exciting can also create the conditions for exhaustion.
At the HIGH OF DAY area, heavy SELLING on Level 2 gave the exhaustion signal. This is where the tape becomes just as important as the candles. When stacked bids begin getting hit, red prints start increasing, and sellers begin refreshing size near the top, the chart starts showing that momentum is losing control.
That type of Level 2 behavior can mark the difference between continuation and exhaustion. A clean breakout usually shows bids stepping up and offers getting taken. But near 7.58, the opposite pressure began to matter: selling pressure increased, red prints became more noticeable, and the chart started showing signs that buyers were no longer absorbing supply with the same strength.
Technical Takeaway
The $CAST move was a strong example of how a multi-day runner can develop after the first breakout leg. The original 1.14 long signal produced a 75.4% LONG MOVE on Friday, but the bigger technical story came from the continuation into Monday pre-market.
Several clues mattered:
The first was the Friday expansion candle structure. $CAST did not just move; it expanded with volume and created a new momentum range.
The second was the VWAP/VWMA behavior. Price continued respecting the short-term momentum structure, and the rising VWMA helped confirm that buyers were still controlling the trend.
The third was the continuation psychology. After Friday’s move to 2.00, the chart could have faded. Instead, it continued building strength, creating the type of pre-market pressure that often attracts momentum traders.
The fourth was the final exhaustion. Once $CAST stretched into the 7.58 HIGH OF DAY area, the move became PARABOLIC. That is where traders needed to watch Level 2 closely. Heavy SELLING, red prints, and weakening bid support gave the technical warning that the vertical extension was becoming vulnerable.
Final Word
$CAST was a powerful example of how a Pro Ticker long signal can develop beyond the first session. From the 1.14 long signal on Friday to the 2.00 same-day move, and then into Monday pre-market’s 7.58 HIGH OF DAY, the chart delivered a massive 564.9% LONG MOVE.
The key lesson is that the move was not just about one candle. It was about the full structure: the setup, the breakout, the VWMA hold, the RELATIVE VOLUME expansion, the PARABOLIC surge, and finally the EXHAUSTION signal near the top when Level 2 selling pressure began to appear.
“Want real-time alerts from Pro Ticker? Download the Pro Ticker app. Stay on the Home page, keep refreshing the Home tab, and you’ll see alerts in REAL TIME as we post them. Now you can also use our new Pro Ticker News Scanner to instantly track the latest market-moving headlines as they break. We start posting alerts every day in the pre-market before 9 a.m. ET.”
Term of Use/DISCLAIMER
ProTickerSignals.com is owned and operated by Beyond Media Ltd (Collectively, the “Publisher”, “we” or “us”). We are an advertising platform with the goal of building a thriving community. You can email us at: editor@protickersignals.com. We may receive payment for promoting public companies. Whenever we send out a paid promotion, we will notify our readers by including the word "Advertorial" at the top of the page and provide a detailed disclaimer about our compensation, who hired us, and the duration of the promotion. For a full disclaimer and disclosure about our paid promotion read our full disclaimer here. Any non-compensated alerts are designed to expand our database for future financially compensated investor relations efforts.
Daily Profile Picks. We would like to give you a clear understanding of our daily profile picks. Our picks are generated using several simple algorithmic criteria to identify stocks that are likely to experience significant intra-day movements. These movements can occur in either an upward or downward direction and are expected to take place within a single trading day. The percentage posted reflects a move from the price level provided to either the high or low of the day.
A percentage does not indicate or imply that a profit was made or that a trade was taken, and any results are purely hypothetical. These are statistics only, and do not reflect actual trades and you should not assume that you will achieve the same or similar results.
Signal prices are provided using pre market data, usually around 9 AM EST. This means that a Signal may happen before the market opens, and may actually be at a price that is not within the regular hour high and low of the day. You should therefore consider all prices that trade after our signal was posted. When we comment on a price move, be aware that this is calculated from the entry signal to the highest or lowest price traded afterwards, including premarket and after hours prices. In all cases prices are within a single, and in some cases multi trading day.
It is important to note that we are not licensed investment advisors, and our ideas should not be construed as personalized investment advice. We are dedicated to providing you with interesting information and potential idea-based opportunities.
However, please remember that investing in the stock market carries significant risks. and, companies with low prices per share are particularly speculative and carry a high degree of risk. So, only invest what you are prepared to lose. It is crucial to conduct your own research and exercise prudent decision-making when making investment choices. We strongly encourage you to consult with a qualified financial professional or advisor who can assist you in tailoring your investment strategies to your specific needs and goals.
Thank you for being a part of ProTickerSignals.com , and we look forward to providing you with timely and informative profiles.
This Website and its owners, members, officers, directors and affiliates may own, or may buy and sell, securities of companies profiled here at any time before, during, or after distribution of information on the companies profiled.
Other Important Information. This communication is never to be used as the basis of making investment decisions and is for entertainment purposes only. At most, this communication should serve only as a starting point to do your own research and always consult with a licensed professional regarding the companies profiled and discussed. Conduct your own research. This is not a recommendation nor an offer to buy or sell securities.
By reading our newsletter and our website you agree to the terms of our disclaimer, which are subject to change at any time. By using our service, you agree not to hold Publisher, our site, its editor’s, owners, or staff liable for any damages, financial or otherwise, that may occur due to any action you may take based on the information contained within our newsletters or on our website. We do not advise any reader to take any specific action. Again, investing in securities is highly risky and so only invest what you can afford to lose.
DISCLAIMER
ProTickerSignals.com is owned and operated by Beyond Media Ltd (Collectively, the “Publisher”, “we” or “us”). We are an advertising platform with the goal of building a thriving community. You can email us at: editor@protickersignals.com. We may receive payment for promoting public companies. Whenever we send out a paid promotion, we will notify our readers by including the word "Advertorial" at the top of the page and provide a detailed disclaimer about our compensation, who hired us, and the duration of the promotion. For a full disclaimer and disclosure about our paid promotion read our full disclaimer here. Any non-compensated alerts are designed to expand our database for future financially compensated investor relations efforts.
Daily Profile Picks. We would like to give you a clear understanding of our daily profile picks. Our picks are generated using several simple algorithmic criteria to identify stocks that are likely to experience significant intra-day movements. These movements can occur in either an upward or downward direction and are expected to take place within a single trading day. The percentage posted reflects a move from the price level provided to either the high or low of the day.
A percentage does not indicate or imply that a profit was made or that a trade was taken, and any results are purely hypothetical. These are statistics only, and do not reflect actual trades and you should not assume that you will achieve the same or similar results.
Signal prices are provided using pre market data, usually around 9 AM EST. This means that a Signal may happen before the market opens, and may actually be at a price that is not within the regular hour high and low of the day. You should therefore consider all prices that trade after our signal was posted. When we comment on a price move, be aware that this is calculated from the entry signal to the highest or lowest price traded afterwards, including premarket and after hours prices. In all cases prices are within a single, and in some cases multi trading day.
It is important to note that we are not licensed investment advisors, and our ideas should not be construed as personalized investment advice. We are dedicated to providing you with interesting information and potential idea-based opportunities.
However, please remember that investing in the stock market carries significant risks. and, companies with low prices per share are particularly speculative and carry a high degree of risk. So, only invest what you are prepared to lose. It is crucial to conduct your own research and exercise prudent decision-making when making investment choices. We strongly encourage you to consult with a qualified financial professional or advisor who can assist you in tailoring your investment strategies to your specific needs and goals.
Thank you for being a part of ProTickerSignals.com , and we look forward to providing you with timely and informative profiles.
This Website and its owners, members, officers, directors and affiliates may own, or may buy and sell, securities of companies profiled here at any time before, during, or after distribution of information on the companies profiled.
Other Important Information. This communication is never to be used as the basis of making investment decisions and is for entertainment purposes only. At most, this communication should serve only as a starting point to do your own research and always consult with a licensed professional regarding the companies profiled and discussed. Conduct your own research. This is not a recommendation nor an offer to buy or sell securities.
By reading our newsletter and our website you agree to the terms of our disclaimer, which are subject to change at any time. By using our service, you agree not to hold Publisher, our site, its editor’s, owners, or staff liable for any damages, financial or otherwise, that may occur due to any action you may take based on the information contained within our newsletters or on our website. We do not advise any reader to take any specific action. Again, investing in securities is highly risky and so only invest what you can afford to lose.
© Copyright 2024. All Rights Reserved.
© Copyright 2024. All Rights Reserved.